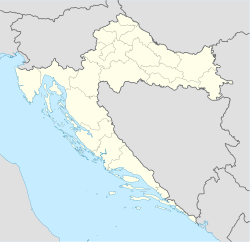
Podbablje
Appearance
Podbablje | |
|---|---|
 | |
| Coordinates: 43°25′00.84″N 17°10′33.96″E / 43.4169000°N 17.1761000°E | |
| Country | |
| County | Split-Dalmatia |
| Area | |
• Total | 44.8 km2 (17.3 sq mi) |
| Population (2021)[2] | |
• Total | 4,035 |
| • Density | 90/km2 (230/sq mi) |
| Time zone | UTC+1 (CET) |
| • Summer (DST) | UTC+2 (CEST) |
| Website | podbablje |
Podbablje is a municipality in Croatia in the Split-Dalmatia County.
Demographics
[edit]In the 2011 census, it had a total population of 4,680, in the following settlements:[3]
- Drum, population 702
- Grubine, population 1,010
- Hršćevani, population 392
- Ivanbegovina, population 268
- Kamenmost, population 520
- Krivodol, population 457
- Podbablje Gornje, population 523
- Poljica, population 808
In the same census, 96.28% were Croats.[4]
Podbablje: Population trends 1857–2021
| population | 3277 | 3445 | 3366 | 3855 | 4795 | 5158 | 5470 | 5693 | 5693 | 6003 | 6127 | 6480 | 6060 | 5884 | 4904 | 4680 | 4035 |
| 1857 | 1869 | 1880 | 1890 | 1900 | 1910 | 1921 | 1931 | 1948 | 1953 | 1961 | 1971 | 1981 | 1991 | 2001 | 2011 | 2021 |
References
[edit]- ^ Register of spatial units of the State Geodetic Administration of the Republic of Croatia. Wikidata Q119585703.
- ^ "Population by Age and Sex, by Settlements" (xlsx). Census of Population, Households and Dwellings in 2021. Zagreb: Croatian Bureau of Statistics. 2022.
- ^ "Population by Age and Sex, by Settlements, 2011 Census: Podbablje". Census of Population, Households and Dwellings 2011. Zagreb: Croatian Bureau of Statistics. December 2012.
- ^ "Population by Ethnicity, by Towns/Municipalities, 2011 Census: Podbablje". Census of Population, Households and Dwellings 2011. Zagreb: Croatian Bureau of Statistics. December 2012.


